![[en] vinibarbosa.research](https://substackcdn.com/image/fetch/e_trim:10:white/e_trim:10:transparent/h_72,c_limit,f_auto,q_auto:good,fl_progressive:steep/https%3A%2F%2Fsubstack-post-media.s3.amazonaws.com%2Fpublic%2Fimages%2F50c13862-170c-45ba-99ea-2f2f44dbd93a_1250x314.png)

Who is building in the crypto bear market?
Who is building in the crypto bear market?
An analysis of the projects with the most 'commits' on GitHub in the last 03 months, ranked by number of 'commits' and ranked by a better ratio with market capitalization.


In the bear market, many less solid projects with worse fundamentals can lose much of their funding and incentives for developers to continue working.
This causes the development of these projects to decrease a lot. And there are those where theirs ‘building’ even stops altogether — regardless of market capitalization.
On the other hand, there are those projects whose development remains solid and strong, regardless of short and medium term price volatility.
The ‘building’ and constant work to improve a cryptocurrency can be a great indication of strong fundamentals and a solid project.
Counterpoints about building
Even so, like any market indicator, this feature should never be considered in isolation to make important decisions. Context and other data are vitally important.
Some counterpoints that can be observed:
New (fresh) projects can have a lot of development activity, just because they are in their initial phase. The older and more active a project is, the better.
More consolidated projects may have low development activity, just because a lot has already been done for a long time.
That said, we can still find good opportunities when looking at activity and engagement in cryptocurrency ‘building’ — and, considering such a saturated market, this can be a great filter.
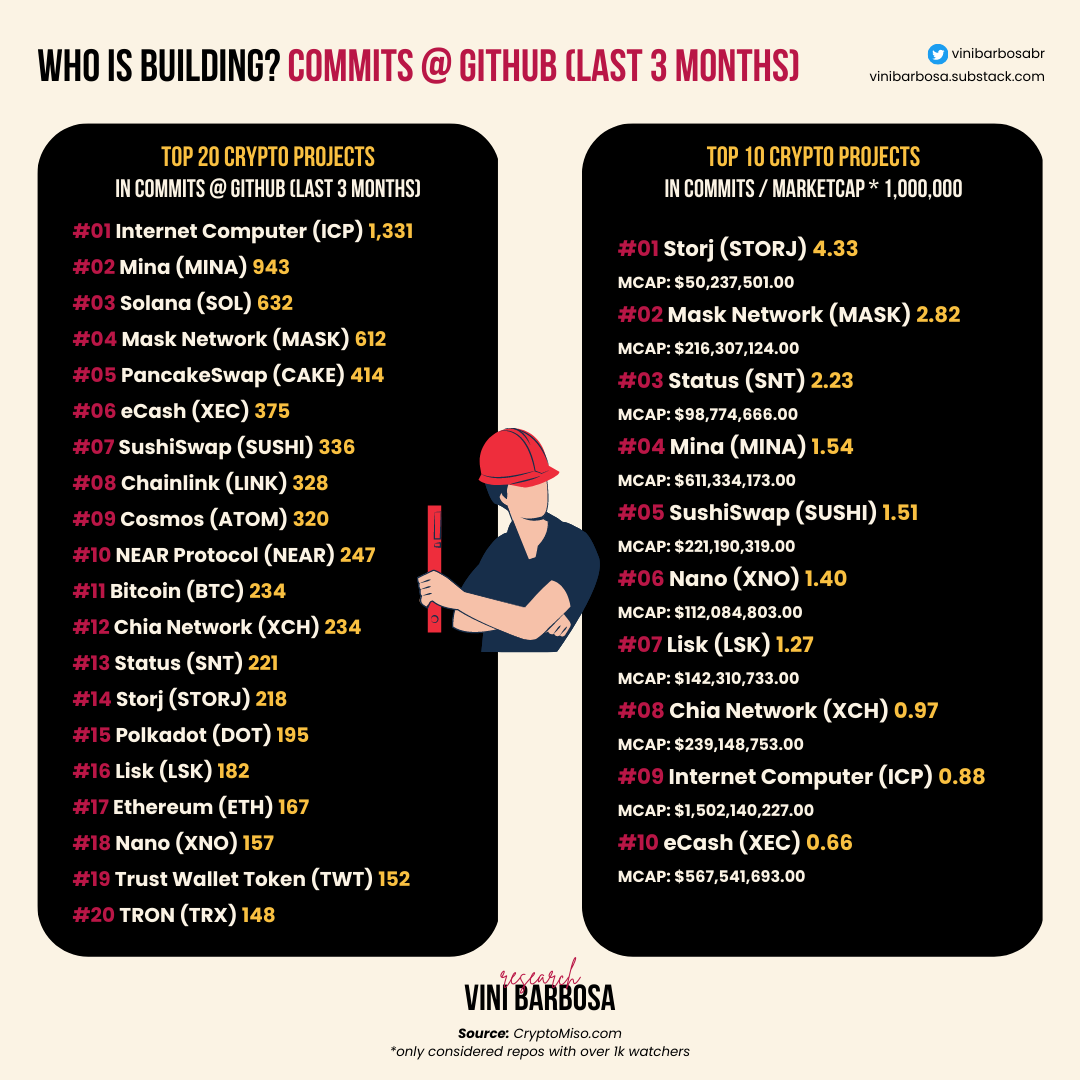
Top 20 crypto projects with the most activity in the last 03 months
I collected the number of 'commits' made in some projects, according to the CryptoMiso.com website and got the 20 cryptocurrencies (or tokens) with the most activity in the last three months.
For this report, I filtered out projects with less than 1,000 'watchers' and very recent ones, as my goal is to find solidity and good opportunities.
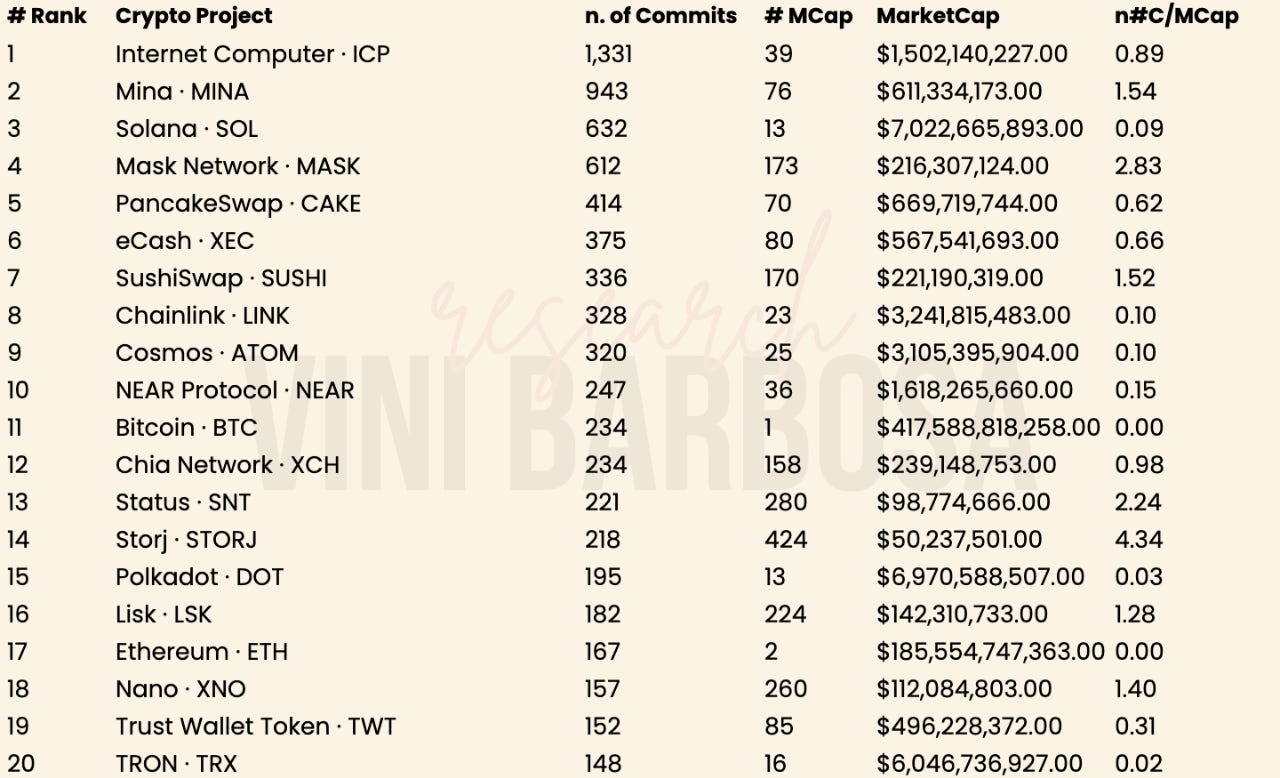
In order, we have:
Internet Computer · ICP - 1,331
Mina · MINA - 943
Solana · SOL - 632
Mask Network · MASK - 612
PancakeSwap · CAKE - 414
eCash · XEC - 375
SushiSwap · SUSHI - 336
Chainlink · LINK - 328
Cosmos · ATOM - 320
NEAR Protocol · NEAR - 247
Bitcoin · BTC - 234
Chia Network · XCH - 234
Status · SNT - 221
Storj · STORJ - 218
Polkadot · DOT - 195
Lisk · LSK - 182
Ethereum · ETH - 167
Nano · XNO - 157
Trust Wallet Token · TWT - 152
TRON · TRX - 148
n#C/MCap — what is it and what does it indicate?
Knowing how to identify the projects that continue to work and build is very important, but for those who are looking for good investment opportunities, we can further refine our analysis by weighting the number of 'commits' with the current market capitalization.
Again, this indicator should not be considered in isolation to make important decisions. It's just… An indicator. Which can help.
To do this, we then divide the number of 'commits' in the last three months by the respective current 'market cap' (MAR 09, 2023) and multiply the result by 1,000,000 for better visualization.
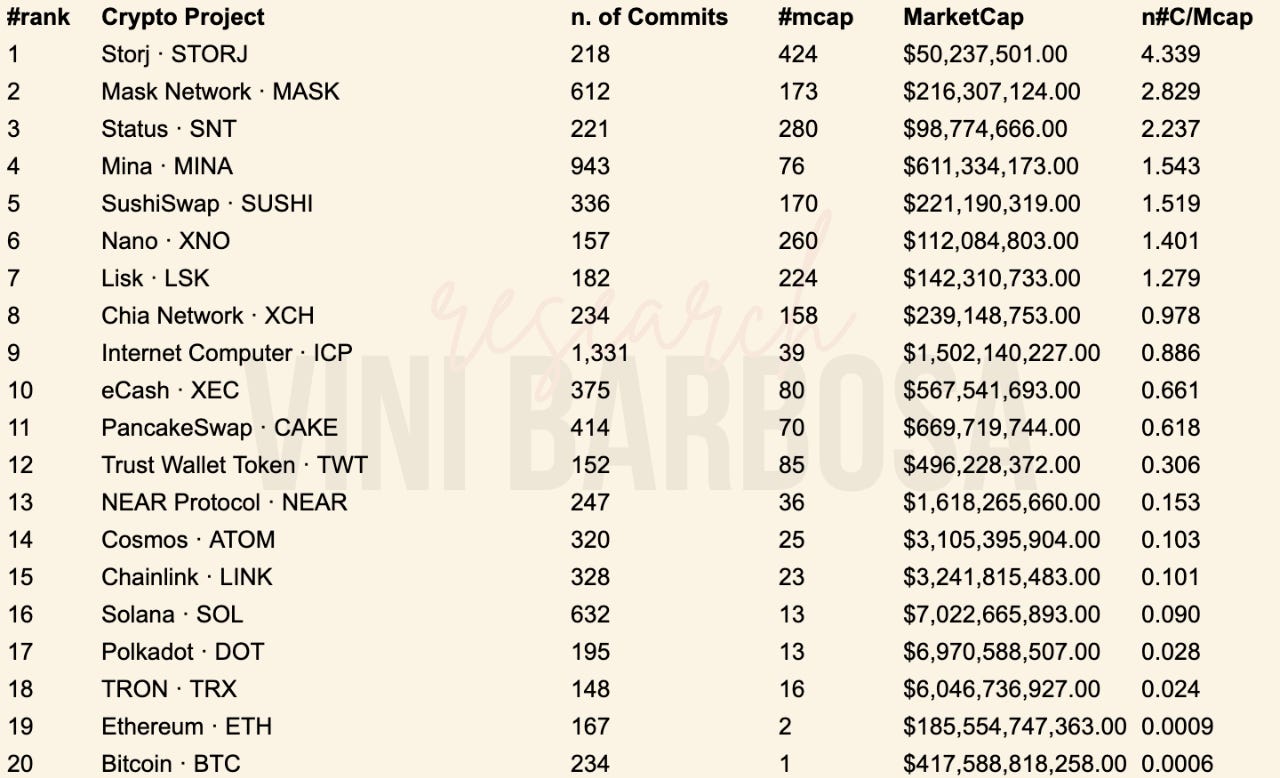
In order, this is what we find:
Storj · STORJ - 4.33
Mask Network · MASK - 2.82
Status · SNT - 2.37
Mina · MINA - 1.54
SushiSwap · SUSHI - 1.51
Nano · XNO - 1.40
Lisk · LSK - 1.27
Chia Network · XCH - 0.97
Internet Computer · ICP - 0.88
eCash · XEC - 0.66
PancakeSwap · CAKE - 0.61
Trust Wallet Token · TWT - 0.30
NEAR Protocol · NEAR - 0.15
Cosmos · ATOM - 0.10
Chainlink · LINK - 0.10
Solana · SOL - 0.09
Polkadot · DOT - 0.02
TRON · TRX - 0.02
Ethereum · ETH - 0.0009
Bitcoin · BTC - 0.0006